


How Much Have GTA Home Prices Changed Over The Last Decade

Toronto's real estate market is trying to recuperate from an unprecedented year of paltry sales numbers and, for some property types, falling prices that still haven't had any impact on affordability given current lending rates.
While the fact that our properties have remained incomprehensibly overvalued for so long (especially in the face of inflation) is enough of a testament to how out of reach housing in the city is for most, there's nothing to drive the point home quite like looking at the average home prices of years past.
And a new report from property listing site Zoocasa does just that, considering the last 10 years of single-family home sales across Canada.
The retrospective, released Monday, shows just how housing prices have been "persistently rising" in recent years despite varying interest rates, a global pandemic and other factors that should bring them down.
"From 2013 to 2023, the benchmark price of a single-family home in most of Canada has doubled," it states. "At the same time, mortgage rates have climbed to a 15-year high."
Compiling year-end data from the Canadian Real Estate Association, Zoocasa found that parts of Southern Ontario have seen property prices skyrocket the most in the last decade, with London & St. Thomas taking the cake for the biggest proportionate price jump: a mind-boggling 178 per cent, or $394,000.
By comparison, Regina saw the average home price surge just 6.3 per cent over the same time, which amounted to the smallest change when it comes to both percentage and dollar amount ($18,800) given how cheap that market is and has been.
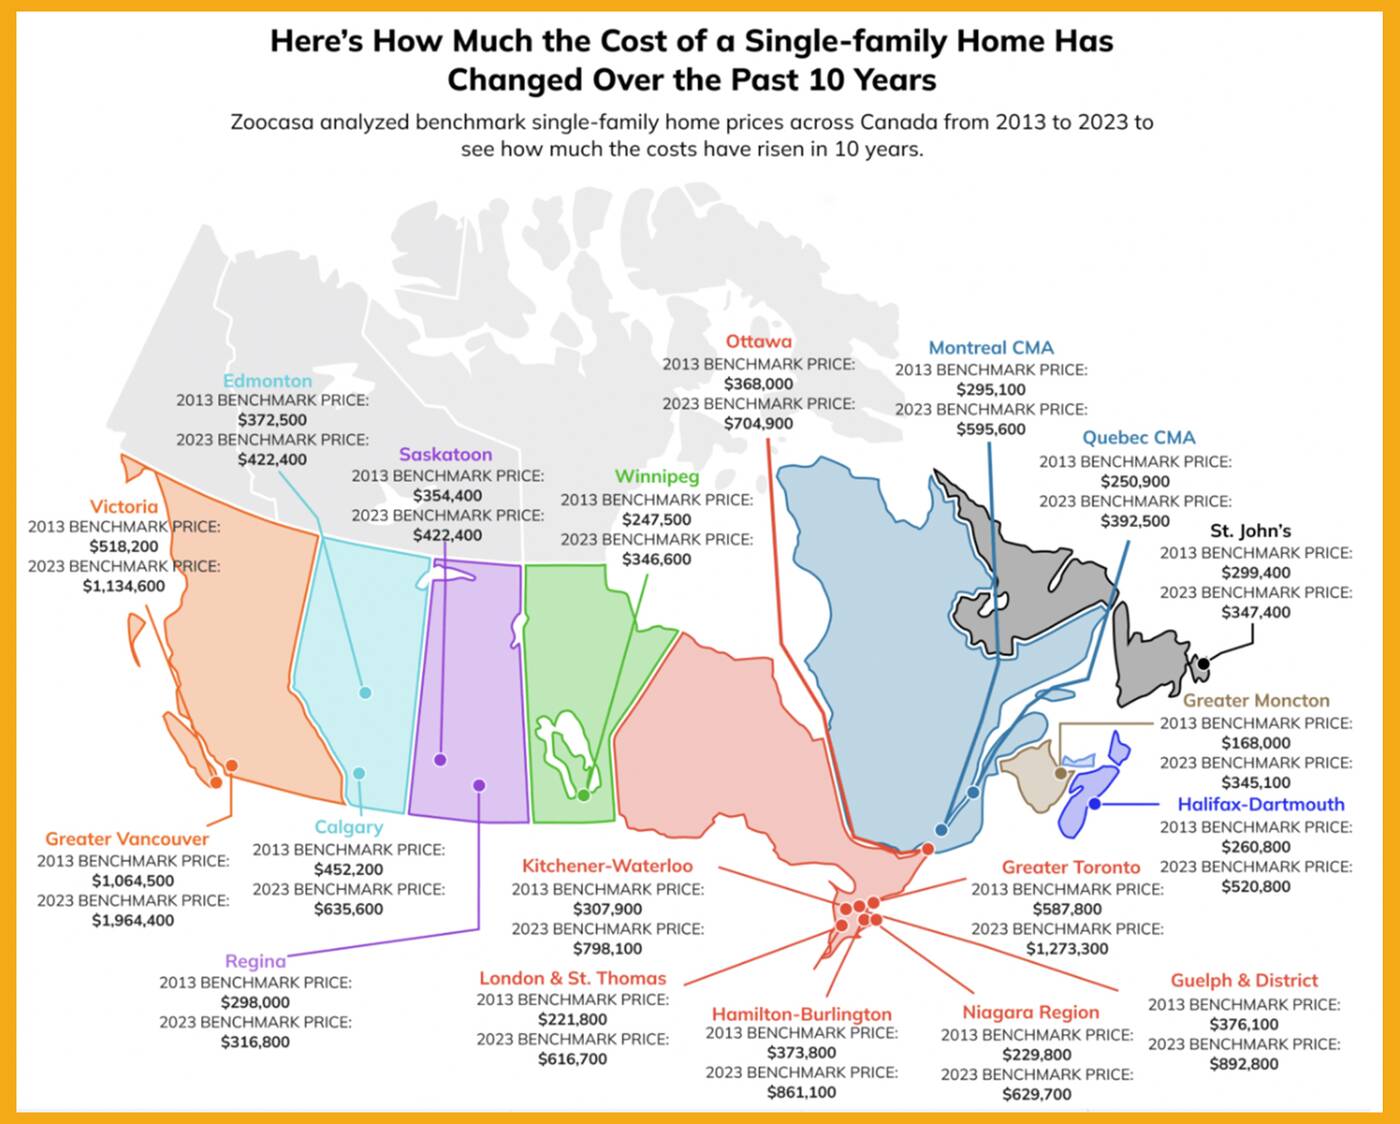
How home prices have spiked nationwide from 2013 to 2023. Infographic from Zoocasa.
Other parts of the GTHA that have seen bonkers price increases are the Niagara Region, where single-family homes escalated 174 per cent (and $399,900) in 10 years, as well as Kitchener-Waterloo (up 159 per cent and $490,200), Guelph (+137 per cent and $516,700 in 10 years) and Hamilton-Burlington (+130 per cent and $487,300).
While these cities comprised the top five for percentage price change over the time period surveyed, Toronto came in seventh, with a price change of 116.6 per cent from 2013 to 2023.
But, due to how exorbitant our market is known to be, our prices jumped the second-most in dollar amount over the decade — $685,500, second to only Greater Vancouver, where prices soared $899,900, which was a comparatively low 84.5 per cent.
With these higher prices and rising interest rates, Zoocasa notes that owners in some locales have seen monthly mortgage payments climb by more than a whopping $2,000 in the last 10 years, eroding any semblance of affordability, especially in Ontario.
BlogTO(Becky Robertson, February 1,2024)